The Turn of the Screw
So, we have Truss now. The continuity candidate, not the dull man who would take away our sweeties. But also, the same old Fed, keen to do just that. And its time we took a look at Starmer, the other continuity candidate and an excellent book on him; required reading for serious investors.
Otherwise, it is always a good summer when nothing changes. Markets swoop and soar vainly trying to catch our attention, but the reality remains that rates have to rise enough to destroy the excess demand that causes inflation. And they have to rise to equal or surpass that level, eye-watering as that prospect is. It will not be over until the US jobs report goes negative, and stays negative; anything less is prolonging the pain.
Presentation over substance
But this is a time of intensely political Central Banks, headed up by people without a grounding in economics, but a lot of “presentation skills”. They will be dragged kicking and screaming and smiling to do what they should have done last year, hoping vainly for some supply side reform or windfall to help out. But largely still facing the exact opposite, populists who think subsidies “cure” or ameliorate inflation.
Markets are oddly buoyant; they get like this at times, but we see that as a mix of delusion, the self-reinforcing strength of the dollar (be very careful of that one, it is a new bubble) and the spluttering remnants of buying on the dip.
But be under no illusion, Central Banks trying to guess where the economy is going is like fly fishing with a jar of marmite. Entertaining, but highly unlikely to catch anything.
Truss: Issues and options
Truss meanwhile looks like a re-run of Boris; it won’t be quite that simple, but it looks like more style over substance, a different set of lobbyists, but nothing really changing. The idea either she or the EU can afford a bust up with the UK, just shows how silly markets can get.
Some of her programme may make sense, both the NI (tax) rises, and the corporation tax increases were badly timed and should be reversed, given inflation is doing the hard work already through fiscal drag (or frozen tax thresholds).
The rises were proposed when we were exiting the COVID crisis, but before we understood the energy one. We said so the last time we wrote to you.
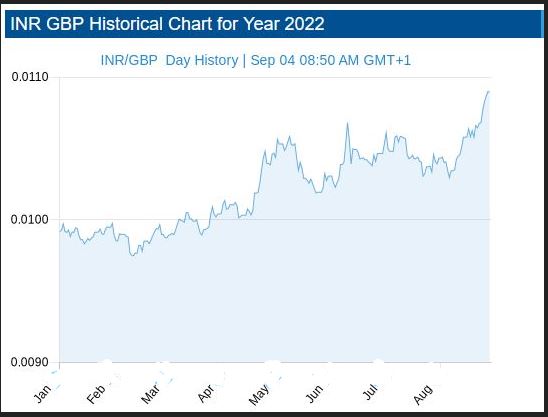
Ditching a few Treasury backed white elephants (HS2, Freeports, the crazy fiddling fetish on capital allowances) would do no harm either, but overall, the market’s verdict is clear: fiscal responsibility is still a long way out. We can all see how sterling has collapsed against the dollar; it is less clear why it has fallen against the Indian Rupee or the Chinese Yuan.
Source: See this website for all the daily data.
A book to read for all investors
So to Starmer, the likely next UK prime minister, where we need to pay more attention. Both on his mindset and on why the Labour Party hates him so much. Which in turn explains why (and with the Tories fatal ideological split heading them into Opposition), he is so fixated on party control.
Oliver Eagleton writes very well. His recent book The Starmer Project looks at four episodes, his left wing legal start, his transformation into a Tory enforcer with a penchant for exporting judicial expertise to the colonies (don’t laugh), his alleged machinations to back the People’s Vote nonsense to bring Corbyn down (pretty dense stuff, even now) and his use as the Blairite stalking horse to put a stop to Corbyn’s chiliastic tendencies, (which also gives you a trigger warning about a light dusting of Marxist ideological claptrap).
So Starmer is all about what works, which would make a nice change.
We’re looking at a very global mindset, apparently quite a strong Atlanticist outlook, keen to work with European authorities, but aware that the Brexit boat has sailed. An interest in devolving power down, but keenly alert to the risk of anarchy that entails. Indecisive, a Labour Party outsider (on his first election in 2015, apparently his nomination had to be held back to ensure he had the minimum length of prior party membership). Starmer is not exactly collegiate, but he has run a Whitehall department (as Director of Public Prosecutions) so not a loose cannon.
Very London too, Southwark, Reigate, Guildhall School of Music (sic), Oxford for post grad law, Leeds as an undergraduate. So should at least know where the Red Wall was. But lest you relax too much, a total ignorance of economics or business, let alone how to create growth. It won’t be easy.
And what about Markets?
Well for a UK (or non US) investor you only had one question this year. If you ditched the local currency you made money, and if you held onto sterling you got hit. Our GBP MonograM model is doing fine, it got that one big call right: kind of all you need. If you are a dollar investor, outside of energy your best place was cash. And our USD model took longer to spot that shift. As for active investing, sadly pretty much the same, the dollar is the story, or dollar assets. All of which perhaps makes dollar earners in the UK look cheap still.
But for now we see the story as a currency one, and at heart that is just about the timing of tightening interest rate spreads. The widening of those spreads has caused the recent havoc.
So when (finally) the European and UK Central Banks abandon futile incrementalism and get the big stick out, that will call the turning point.
Charles Gillams

Hard Landings?
Local elections tell us remarkably little about national ones. We reflect on those. Meanwhile US equity markets are in turmoil, and some big numbers are changing very fast - some further musings.
Do English local elections count ?
We start with the UK, or rather English local elections, the devolved governments (oddly) have a rather greater read through from local to national. But overall, nothing in the results changed our view that Boris will probably survive, unless the Tory party unites around an alternative, which is pretty near impossible: it has too many splits.
Nor has our long-standing opinion that all Keir needs to do is keep his head down and he will be the next Prime Minister changed. Although if Labour starts to believe it is a shoo in, and can pick who it likes as leader, it will also self-destruct. Which is just about the only chance the Liberal Democrats have of being relevant.
Just how politically marginal local elections are, is shown by the surge of support for the Greens, apparently the very voters the weird Tory infatuation with hard left environmental policies were meant to entice.
Indeed, a whole set of Tory policies designed to raise energy prices, have gone down like a lead balloon.
What voters want and politicians need to deliver
You do wonder if they will ever get round to realising voters really want just three things, a roof over their heads, bread on the table and a job. Deliver those and do so competently, and politics is easy.
The roof bit is a shambles; it turns out policies designed to enrich cabinet members and senior civil servants with buy to let portfolios, are not so good for anyone else. I suspect the job bit will soon turn turtle, and the bread bit is going off the rails too. See graph below:
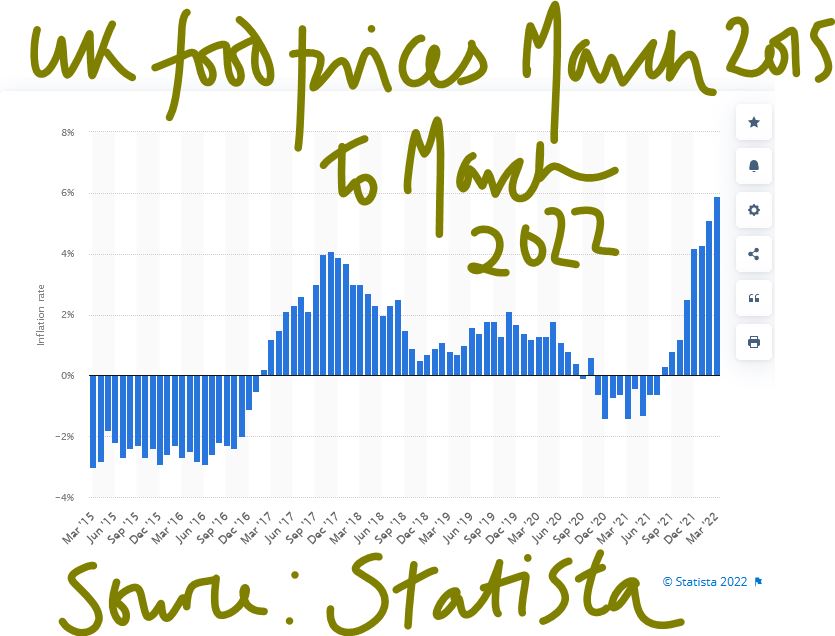
Here is a link to the relevant page on Statista
We notice that the big Western democracies still seem hell bent on raising energy prices, which is universally unpopular.
UK local elections - a brief look at opposition policies
So, the other thing markets in the UK (and sterling) will be doing is wonder about Starmer policies, more critically does he have the “bottom” to either appoint radical reformers, or have them lined up in key seats? Let’s say he does. He will still continue the headlong wealth destruction of punitive taxation and the assault on business investment. He will over-regulate (that’s his background). The sole variable therefore feels like any plausible capacity to reform.
He is not afraid of hard choices, or of thinking long, both good points and incidentally he is not Blairite enough to be America’s poodle and get involved in picking pointless foreign wars. Although he will likely dismember the United Kingdom, either of political necessity or by accident. We really can’t see much support for sterling in that package.
Central Banks - are they signalling a hard landing?
Inflation is spiking into double figures, and Central Banks are explaining
1) it is really not their fault
2) they are only responsible for “core inflation” (so without the important stuff)
3) but anyway they must still raise rates to offset the malign effects of other state policies.
It is looking truly absurd.
Not that interest rates are off the floor yet, although the US bond market seems convinced rates over 3% are now nailed on, while oddly the UK Gilt-edged market seems unconvinced of exactly the same thing. This of course is helping an on-going collapse in Sterling.
Meanwhile the possibility of ending negative rates in Europe has caused great excitement and the Euro to strengthen, at least against sterling. The divergence is related to a belief that the Fed which raised three months after the Bank of England is now more hawkish, a belief which seems more about wishful thinking than anything the Fed has actually done so far.
We are less sure on how high interest rates go. All three Central Banks seem to be hoping something will turn up, and inflation will ease. This is a view we share, but we really doubt the trivial rate rises so far, are the “something”.
Market turmoil - how far will they fall?
This leads on to the current market turmoil: With the US feeling very exposed, partly because it went up so high (relative to other markets), it has further to fall. Nor do we see the valuations on quoted US growth stocks as offering good value at these levels. They had become so detached from reality the gap is just too big, and the repeated attempts to buy the dips, just disguises a long-term trend down. The FTSE100 over five years is down, and the NASDAQ climbed over 100% in the same time. A 25% further US fall is at the least plausible.
Other markets will then get sucked down, and in Europe and Japan they are hard hit by their reliance on imported energy (the US is an energy exporter). While for now, their rates are not moving either, the resulting devaluation makes the value gap to US growth stocks, feel even greater. Buying overvalued stock in an overvalued currency, is not always great.
What do our models say about the markets?
Our MonograM momentum models suggest a turning point for both Europe (including within that bundle the UK) and Japan is close. It is only a model, we remind ourselves, and is quite able to give a false signal. It also sees this as true in dollar terms, not sterling. So, there is plenty of noise and last week had all the elements we dislike, a month end, plus a shortened market week, plus Central Bank meetings, created a baffling miasma of signals.
However, on current policies we anticipate a crash; the only issue now is how hard the landing is.

DETONATION OR ROTATION
Two big market forces are at work just now, one is rotation out of the low interest rate winners, to wherever we go next, the other might be something more spectacular.
Enough of the market still sits in the “don’t know” category, to make everyone uneasy. The VIX is high.
So, what would cause the more explosive outcome? Traditionally higher rates divert more of the profits of indebted companies to banks and bondholders, so the theory goes, reducing dividends. Or at the more extreme level, this also makes refinancing debt harder.
This comes with a ‘second order’ impact, in that consumers or buyers also shovel more towards the banks, less towards the producers.
But none of this seems remotely likely yet, the world is awash with cash, and savings levels and interest rates have barely stirred from their COVID slumber.
Markets seem to be just talking about normalising, not slamming the brakes on.
Will we grow regardless of inflation?
The other big risk would be a failure of non-inflationary growth, which also seems unlikely. There are few practical signs of governments enacting the type of supply side restraint needed, we know. We still look for some self-restraint on how much governments seize in taxation; with high inflation taxes should be being cut, or thresholds systematically raised, but that’s also not happening.
The ‘idiot populace’ as curated by the media, constantly wants more supply side restrictions, greater consumption and lower prices, as if this was all somehow available; it is not. The worry here is that governments having messed up the big issues, give way to yet more populist demands for the impossible. At the same time, markets are also getting a little less keen to finance such nonsense or, being markets, raising the price at which they do so.
Well, all that is possibly true and has been happening for a while, but the old theory was that innovation was too fleet footed for any of that stuff to matter much. This is getting a bit tired, but broadly still seems to hold.
What if Ukraine does erupt?
So, the third detonator is in Vlad’s hands. Is a reverse Barbarossa coming down an autobahn near you? Well let’s assume yes, because he’s finally lost it. It is still fairly clear that if he steps onto NATO territory his army is in trouble, US and NATO airpower will rapidly outgun him. So, I discount that. But perhaps Ukraine does indeed end up like Belarus. China will support Putin, so the UN is irrelevant.
Then what? Well, a nation the size of Spain gets locked out of European commerce. Not important. Defence spend goes up? Well, some would say ‘about time’. Germany can decide to burn coal or nuclear or freeze, see previous answer. Come to that, so can we.
Given Russian gas must go somewhere, a bit like Iranian oil, it probably goes to China, which then trades it or cuts back its own Far East imports. Gas as we all know, can’t be stored for any useful length of time. Russia needs the earnings from it, so it will emerge on the market somewhere, at pretty much the current price.
It will be messy, it will create hard choices, but Russia is well on its way to autarky already, it can certainly live without dollars. Is this really a detonator? On its own, I doubt it.
Where is the rotation?
So, we still conclude all this market reaction is rotation, and it is out of overpriced US equities, where Biden created the biggest inflation bubble by far, and where interest rates are rising faster than elsewhere in the OECD. Hence, we see the hazard as mainly still on Wall Street, and to a lesser degree to the US economy. We’re looking at rising rates, a strong dollar, increased detachment from the global economy, and none of it helps earnings, but nothing is catastrophic either. The US (unlike the UK) wisely seized the chance to be energy independent.
But even so, we are not yet that concerned, valuations in the US are still extreme, as many sets of earnings seem to show, once the market looks at forward guidance, it shudders, and prices fall. A lot of built-in growth is needed to get price earnings ratios back down to earth, and that’s what’s being hit just now. To use a forty or fifty times earnings multiple, needs a lot of confidence about the future. That stretched temporal certainty is now lacking.
This is not that unusual for a rotation, but in that case, markets will bounce, and that will suddenly move a lot of funds off the side lines and back in. Where is that process now? Well going back to the Jan 27th low is causing some excitement. But we are not sure even that’s a disaster. Overall, the taking out of that and the October 2021 S&P low, won’t be fun, but the market still had a heck of a run up last year.
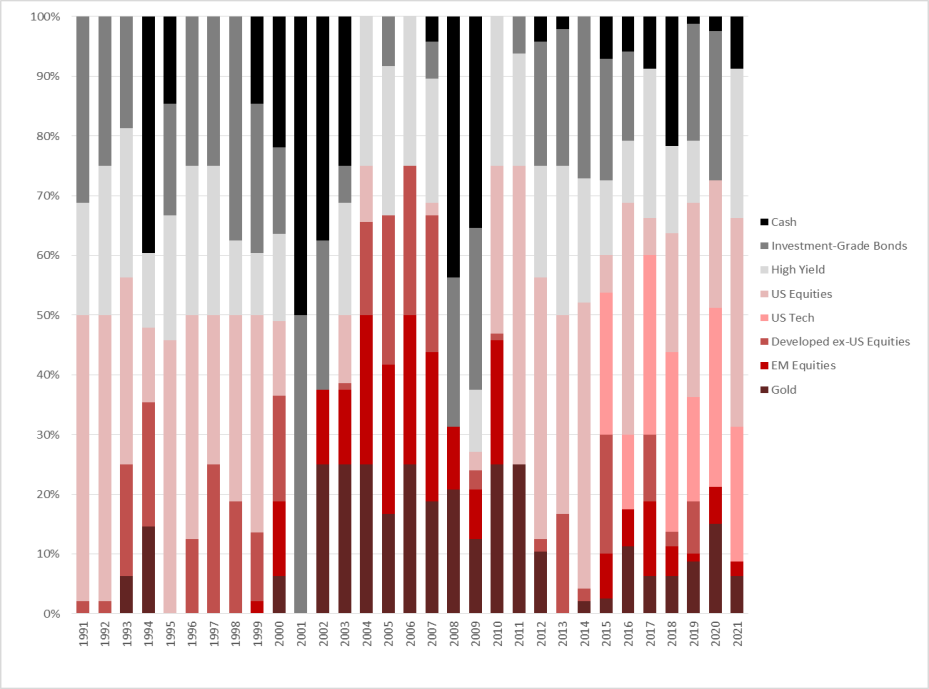
Have a look at where our MonograM investment model allocates funds based on momentum, over the last three decades, the US is absent for significant stretches. We rebalance monthly, the next one will be most interesting.
And inevitably, we do feel cautious too, but it is about levels, not wipe outs. Rotation not detonation.
Charles A R Gillams
Monogram Capital Management Ltd

River Deep, Mountain High
Welcome back Mr. Powell - so what is a good response to impending inflation?
After nine months or more the newly reappointed Fed Chair conceded the blindingly obvious: we have an inflation issue, along with the equally transparent need to tighten monetary conditions to quell it. At least he’s fronted up to that, unlike the position in Europe.
What diverts us is what the right response is. Some things are perhaps obvious: gold at least in sterling terms now has positive momentum again. But there is a tremendous volume of liquidity to soak up still, while stimulus will keep being pumped in for a long time. But fixed interest just looks hopeless, credit quality is plummeting, rates are rising, and returns are poor, even in high yield.
Are we clear of COVID effects?
Nor are we really clear of COVID effects. We are yet to pass beyond all the “emergency measures”. So here in the UK, VAT is still reduced, commercial evictions banned, and government departments are still showing that odd mix of budget destroying costs and below normal productivity. So, spending pressure will stay elevated for a good while. Tax rises on corporate profits and on labour through National Insurance hikes, will therefore start to bite, well before the last variant has caused another pfennigabsatze-panik. (spike/trough related panic)
Markets have also been jittery. In general, the buying opportunities just after Thanksgiving have held, which is a good sign. The subsequent gyrations have (so far) indicated a good weight of money ready to buy the dips. But there is little doubt cash is fleeing the overhyped stocks, which are far more prevalent in the US, than in the UK. The shift out of basic commodities is also apparent. So, I would still expect enormous cash balances to build up into the year end in the banking sector, albeit maybe not always in the right places. Any Santa Claus rally will be strictly retail elf driven; the old man is self-isolating this year.
Characteristics of this inflation
Our view remains that the expected high inflation is systemic, simply because of the structural damage and inefficiency inflicted by COVID. So, it maybe transient, but multi-year transient. In this case while the seasonal moves down in energy prices will be a welcome relief, assuming Northern Hemisphere temperatures stay around seasonal norms (and that’s what mid-range forecasts are indicating) - it is not a solution to the inflationary pressures.
Nor do we see the any unwinding of the inventory super cycle caused by the holiday season and the ending of lockdowns, all at once, as having much beneficial impact on price levels.
Businesses all want inventory and will keep rebuilding it across their full ranges for a while. After all, right now holding stock has little financial cost attached.
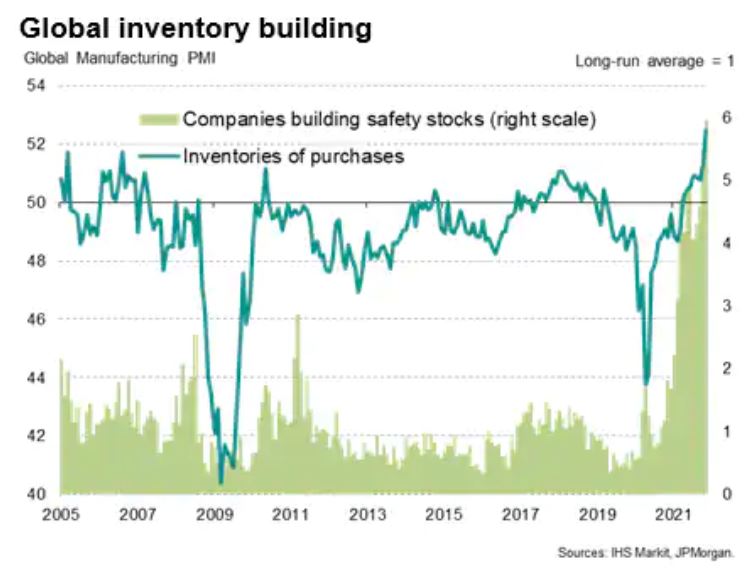
See this article published by Markit.
Most corporates are at heart squirrels; it won’t be easy to break a new habit.
So how should we play this?
The bigger issue is how to play this - the received wisdom is pile into the US, probably the NASDAQ, while having a side bet on bitcoin or some less disreputable alternatives.
That’s where most investors knowingly or otherwise have their funds.
NASDAQ may churn as dealers try to create some volatility, but the overall (and in our view inflated) levels will most likely remain.
This Omicron variant episode at least has halted the IPO madness, and the whole SPAC nonsense is washed up. Sadly, not a big surprise to see portly old London has just tried to catch a train that left the station last year.
The longer view
But it is a bubble we think - our icf economics monthly looks in more depth at how these played out the last couple of times. Not pleasant, but oddly familiar.
NASDAQ and Bitcoin may yet scale new peaks, but the river below is very deep. Perhaps that old affection for base gold is not just nostalgia?
Time for some year end reflection.
Charles Gillams
Monogram Capital Management

Which is the Leviathan?
This is a week to ponder the role of private equity in portfolios, in what may be an early phase of a great investment and technological explosion. There seems to be no sign of higher interest rates and a stubborn refusal by Central Banks to care much about inflation. The talk of a UK raise always looked to us like a head fake which we ignored.
Spotting good and bad private equity
So first to private equity, a beast that comes in many guises, not all benign from an investor viewpoint. All liquidity fueled equity explosions come with a heavy loading of chancers; Bonnie and Clyde’s rationale for bank robbery remains valid.
Good private equity relies on management being superior to that of their targets. This can be in their analysis, their execution, their swiftness of foot or their innovation. All of this generally flourishes away from the hidebound inertia of many listed companies and their professional Boards of tame box tickers.
Bad private equity uses accounting tricks, the malleable fiction that the last price is the right price in particular, and the terrible phrase “discounted revenue multiple” which is a nice conceit for “never made a profit”. All of these share the same vice of management marking their own work.
So, we struggle with the likes of Scottish Mortgage and its little array of unquoted Chinese firms, the alphabet soup of non-voting share classes and love affair with management. Maybe they are that skilled, but nothing that looks like a real two-way market is evident to us, in many of these valuations. We have by contrast long admired Melrose Industries for their quite ruthless devotion to turning over their investments, good or bad and stapling executive pay to actual cash realizations paid to investors.
Where we stand – given our strategy
For an Absolute Return specialist there are added constraints: we want to hold under twenty positions altogether and all in ones we can sell tomorrow afternoon. And we like holdings where valuations are transparent, there is no gearing (there is usually quite enough in the private equity deals already), and you can pick them up for a fat double digit discount: oh, and we do like a yield too.
So, we are looking for big, listed options with hundreds of high-quality funds bundled together and for any yield, a bias towards management buy outs. We are certainly not at the venture capital end, with silly pricing, high fail rates, unrealistic managers, and not a decent accountant in sight and aspirations to change the world. Met those, invested in too many, and donated more shirts off my back than I care to enumerate to their serial failures and inexhaustible funding rounds.
But there are good things about Private Equity, one is that in a rising market, it can be like clipping a coupon. The accounting rules require them to be backward looking, so coming out of a trough they are typically reporting on valuations that are three or four months old, which in turn reflects business activity up to six months old. As they trade at a discount of typically 25% or so, you can buy today at a 25% discount to the value of the business they were doing in the spring. There are no guarantees, but for most, that was a lot worse than current conditions, so today’s price is simply wrong. This is a time machine that lets you buy now but pay at old prices.
Watch for built in volatility in private equity
These lags are complex, the reference points are often public market valuations, and so there is volatility built into them. While in an Absolute Return fund, not only are choices limited but the overall exposure must be too. However, in those rare purple patches of fast recovery and expansion they are excellent for performance.
What kills these bonanzas off is tight credit. In part they need debt for trade, but also their realizations rely heavily on it. A closed IPO market does them no good (just as they enjoy an exuberant one). That is a risk, as liquidity starts to tighten, that this will hurt, but as Powell and the Bank of England both showed, there is no political appetite for that just yet.
The UK and US on taming the leviathan
Indeed, Sunak’s UK budget yet again feels reckless, devoid of any discipline and with every department cashing in. Government spending is predicted to rise to 42% of GDP by 2026, a fifty year high. Healthcare alone is predicted to have grown by 40% in real terms since 2009 (both estimates from the oddly named Office for Budget Responsibility). At that level of loading, it is inching closer to hollowing out the entire budget and causing it to implode. (Leviathan was just such a creature “because by his bigness he seemes not one single creature, but a coupling of divers together; or because his scales are closed, or straitly compacted together” feels an apt description of this new giant state apparatus.)
But that gamble means there is no room to pay higher interest rates, or the economy will be reduced to a double-sided monster. The one face devoted to raising debt and levying taxes and paying interest, the other to feeding out of control public spending, with nothing left in between.
Thanks in a slightly odd way to a Democrat Senator, America has avoided throwing itself under that same bus, but with no effective political opposition the UK is now powerless to resist. Sterling’s relentless decline from the summer high and a FTSE 100 index still below its pre-COVID peak signify what markets feel about all this.
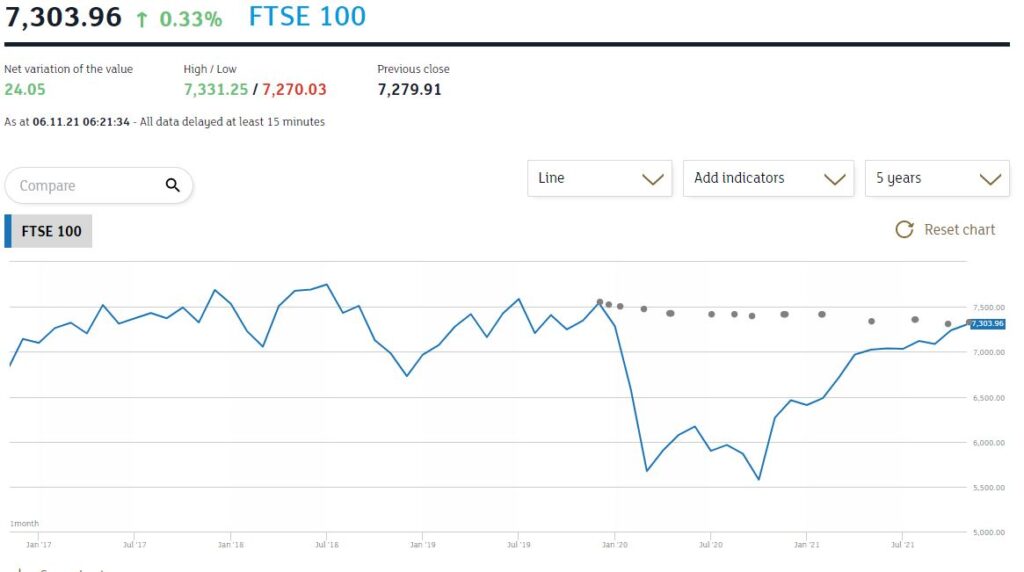
From the London Stock Exchange graph
So, while we were more bearish than we have been all year, in terms of asset allocation, at the end of October, we have yet to call time on the Private Equity cycle, that has provided such a powerful boost this year. It still feels good value to us.
Of course, we recognize too, that the populist fear is of the wealth creators and an opposing adoration for wealth consumption. Unlike politicians, however, we are tasked with producing real results not vapid dreams.
I guess we can each choose which to regard as the leviathan – the burgeoning state, or private equity.
Charles Gillams
Monogram Capital Management Ltd